
In the world of trading and investing, people are always looking for good ways to guess where the market will go next. One helpful tool for this is candlestick patterns. These patterns are part of technical analysis, which traders use to understand market trends better. They use pictures to show what people buying and selling are thinking, which helps in guessing where prices might head in the future. This article will talk about where candlestick patterns came from, what they are, and how to use them in predicting market changes.
Understanding Candlestick Patterns
Candlestick charting, tracing back to 18th century Japan, uses open, high, low, and close prices to create a visual representation more intuitive than standard bar charts. Candlesticks, resembling candles with wicks, depict price movements, where the body illustrates the difference between opening and closing prices.
Key Candlestick Patterns
- Engulfing Pattern: Indicates potential reversals. A bullish engulfing pattern suggests a bullish reversal, inviting buying opportunities, while a bearish engulfing pattern signals a bearish reversal, hinting at shorting opportunities.
- Hammer Pattern: Characterized by a small body and a long lower wick, this bullish pattern typically signals the end of a downtrend, indicating buyer strength.
- Evening Star Pattern: This bearish pattern, effective after an uptrend, suggests a shift from bullish to bearish sentiment, often seen as a strong sell signal.
Applying Candlestick Patterns
Applying candlestick patterns in market analysis requires a nuanced approach, recognizing both their strengths and limitations. These patterns, steeped in the rich history of Japanese technical analysis, offer powerful insights into market sentiment and potential price movements. However, they are not foolproof. Their predictive accuracy can vary significantly depending on several key factors.
Firstly, the timeframe under analysis is crucial. Candlestick patterns can yield different implications in short-term scenarios compared to long-term trends. For instance, a pattern observed on a daily chart might suggest an immediate market reaction, while the same pattern on a weekly chart could indicate a more gradual shift in market dynamics.
Secondly, the prevailing market context plays a critical role in interpreting these patterns. Factors such as current market trends, overall trader sentiment, and even global economic conditions can influence the effectiveness of candlestick pattern predictions. A bullish pattern in a generally upward-trending market might reinforce a positive outlook, whereas the same pattern in a declining market could be less reliable.
Lastly, external factors, particularly political events, can dramatically impact market behavior, thus affecting the reliability of candlestick patterns. Political instability, policy changes, or significant geopolitical events can create market volatility that overrides typical pattern predictions.
Enhancing Accuracy
- Combine with Other Technical Indicators: Tools like RSI, Bollinger Bands, or Moving Averages can provide additional confirmation.
- Use Higher Time Frames: Analyzing candlesticks on daily or weekly charts offers a clearer market perspective.
- Consider Market Context: Assess the overall market conditions, including trend direction and market sentiment, to validate candlestick patterns.
- Validate with Volume: Increased volume during pattern formation can confirm the pattern’s strength.
- Backtesting: Evaluate the effectiveness of patterns on historical data to identify the most reliable ones.
Risk Management
No pattern is 100% accurate. Employing risk management strategies like stop-loss orders and position sizing is crucial to safeguard against significant losses.
Bullish Engulfing with Trendlines and RSI: A Simple Trading Strategy for Beginners
This strategy is a straightforward yet effective way to spot potential market reversals using three key technical tools: the Bullish Engulfing pattern, Trendlines, and the Relative Strength Index (RSI).
Step 1: Identify a Bullish Engulfing Pattern
- Look for a small red (or down) candle followed by a larger green (or up) candle.
- The green candle should completely cover (engulf) the red candle. This pattern often signals a possible switch from a downtrend to an uptrend.
Step 2: Draw a Trendline
- Connect two or more low points on your chart with a straight line. This line represents the trend of the asset’s price.
- Wait for the price to break through this line, indicating the trend might be changing.
Step 3: Check the Relative Strength Index (RSI)
- Use the RSI indicator, which moves between 0 to 100, to measure market momentum.
- An RSI near 30 suggests the market is oversold. This means the downward trend could be weakening, and an upward trend might start soon.
Combining These Elements
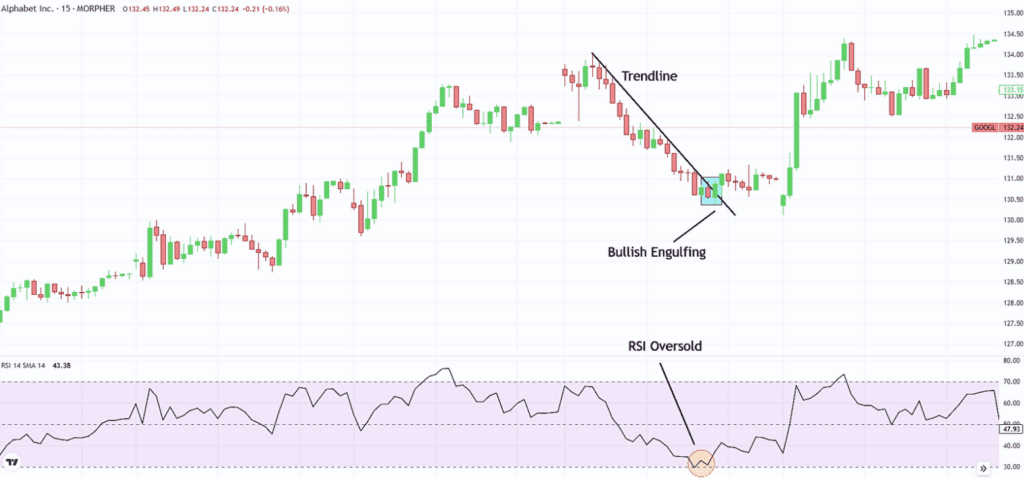
When you see a Bullish Engulfing pattern at the same time as a trendline break, and the RSI is around 30, it’s a strong signal that the market could start going up.
Example: Alphabet (GOOGLE) 15-Minute Chart

- On 29 September 2023, these conditions were met in the Alphabet (GOOGLE) chart.
- A Bullish Engulfing pattern formed right as the price broke the trendline.
- The RSI showed an oversold condition, reinforcing the potential for a market reversal.
How to Trade This Strategy
- Entry Point: Consider entering a trade when the price closes above the trendline.
- Stop Loss: To manage risk, set a stop loss. Refer to a detailed guide on stop loss strategies to decide the best place to set it.
Remember, while this strategy can be effective, no strategy guarantees success in every trade. Practice, learn, and use risk management to improve your trading skills.
Next Steps for Application
Candlestick patterns are invaluable in trading, providing insights into market psychology and potential price movements. By combining them with other technical analysis tools, considering higher time frames, and implementing solid risk management, traders can enhance their prediction accuracy and make more informed decisions in the financial markets.
Start Practicing: Use a trading simulator or a demo account to practice identifying and interpreting candlestick patterns in real market conditions.
Continuous Learning: Deepen your understanding by studying more about each pattern and its implications in different market scenarios.
Apply the Strategy: Utilize the simple Bullish Engulfing with Trendlines and RSI strategy as a starting point. Remember the steps: identify the pattern, draw the trendline, and check the RSI.
Monitor Real Markets: Follow live markets to see how candlestick patterns play out in real-time. This will help you gain practical insights and confidence.
Join a Trading Community: Engage with online forums or local trading groups to learn from experienced traders and share insights.
Remember, while candlestick patterns are a powerful tool, they are not infallible. They should be part of a broader, well-rounded trading approach that includes thorough market analysis, use of various technical indicators, and solid risk management practices. Keep honing your skills, stay updated with market trends, and gradually build your trading strategy for success in the financial markets.