
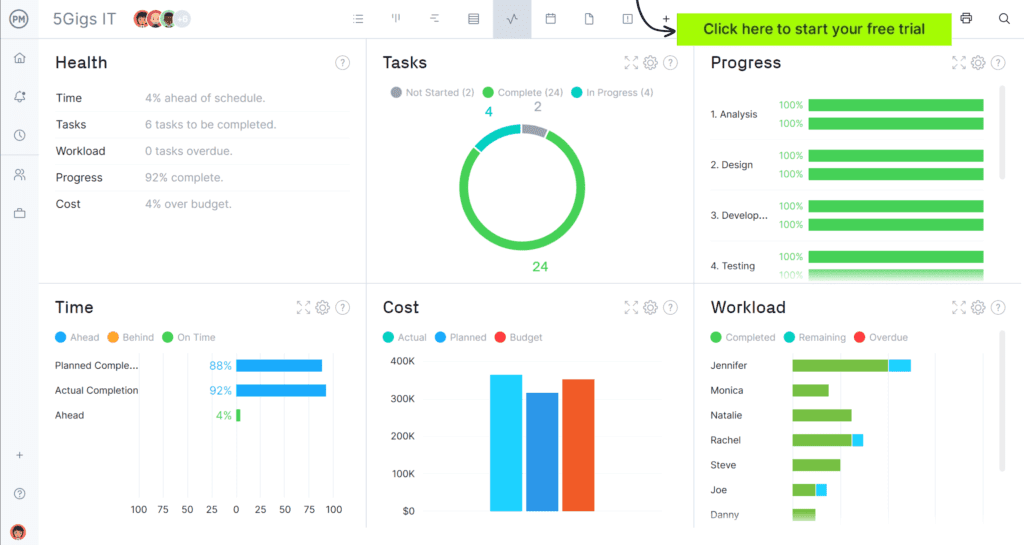
A Power BI project management dashboard can quickly become one of two things: a trusted management tool that improves decision-making, or a glossy report that gets opened a few times and then ignored. The difference usually comes down to fundamentals. The best dashboards are built around real governance needs, use consistent project data, and are updated on a predictable cadence. They make it easier to identify what needs attention, not harder.
This guide walks through how to build a project management dashboard in Power BI, what to include, how to structure pages for different audiences, and what operating habits keep the dashboard useful over time. The goal is a dashboard that supports portfolio oversight without creating a new layer of admin for project teams.
Start with the decisions the dashboard should support
Before you design visuals, decide what the dashboard is for. In portfolio environments, there are five common decision types:
- Intervention – which projects need help and what is driving risk?
- Sequencing – what should start next, what should pause, what should stop?
- Capacity – where are we overloaded and what will slip as a result?
- Governance – what approvals or escalations are needed and by when?
- Benefits – are we delivering the outcomes we committed to?
If your dashboard cannot support at least one of these decisions, it is likely to become background noise. A useful dashboard reduces time spent compiling updates and increases time spent acting on the right problems.
Get the data model right first
Dashboards fail more often because of inconsistent project data than because of poor visual design. If teams report status differently, or if updates are irregular, Power BI will surface those inconsistencies at scale. The first build should focus on a minimum, repeatable data model that teams can maintain.
The minimum project data set
Most organisations can build an effective dashboard from the following fields:
- Project ID (or unique key)
- Project name
- Project owner
- Sponsor
- Department, programme, or workstream
- Project category (for example, compliance, digital, operational improvement, customer)
- Priority (a small set of tiers)
- Start date and target end date
- Current stage (define, plan, execute, stabilise, review, or similar)
- Status (green, amber, red)
- Status trend (improving, stable, deteriorating)
- Status rationale (short written explanation)
- Next milestone and milestone date
- Top risks and issues (or a link to a structured list)
- Decisions needed and required date
- Last updated date
The status rationale and last updated date are often the difference between a trusted dashboard and an ignored one. Rationale explains the colour. Last updated tells users whether the dashboard is current.
Define consistent reporting rules
Agree definitions for green, amber, and red, and define triggers that shift status. For example:
- Any missed milestone beyond an agreed threshold cannot remain green
- Any unresolved critical risk past a due date triggers amber or red
- Any blocked dependency beyond a set number of days triggers escalation
These rules reduce optimistic reporting and make the dashboard meaningful across teams.
Choose your data sources and keep them practical
Power BI can connect to many systems, but reliability matters more than novelty. For project dashboards, common sources include:
- Microsoft Lists or SharePoint lists for project register and status updates
- Excel files stored in SharePoint when a simple model is sufficient
- Planner or task systems for task roll-ups, if consistency exists
- PPM systems that already store consistent project fields
Start with the source that is easiest to keep accurate. A “perfect” source that teams do not maintain will produce worse results than a simpler source that is updated consistently.
Design the dashboard as a small set of pages, not one massive report
A common mistake is trying to satisfy every stakeholder on one page. Build a small number of pages with clear purpose. Below is a practical structure that works for most portfolios.
Page 1 – Executive overview
Purpose – provide a fast portfolio health summary and highlight exceptions.
Include:
- Total active projects and projects by category
- Projects by status (green, amber, red)
- Status trend over time (are we improving or deteriorating?)
- Top projects at risk with short rationale
- Decisions needed in the next 2 to 4 weeks
Filters – department, category, programme, owner, priority.
Tip – keep this page clean. Leaders want to see what needs attention, not every detail.
Page 2 – Projects at risk and recovery
Purpose – support weekly governance and intervention discussions.
Include:
- Filterable table of amber and red projects
- Status rationale and trend for each project
- Primary risk drivers (dependency, resourcing, vendor, scope, technical, change impact)
- Recovery plan indicator (defined, in progress, not defined)
- Escalation items and decisions needed
Tip – tables and slicers are often more useful here than complex charts because users need to move quickly from overview to specific action.
Page 3 – Milestones and delivery outlook
Purpose – help leaders see what is coming and where delivery pressure will peak.
Include:
- Upcoming milestones in the next 4 to 8 weeks
- Projects with repeated milestone slippage
- Delivery phase distribution across the portfolio
- Dependencies linked to upcoming milestones
Tip – milestone views become more valuable when milestone naming is standardised. Avoid capturing dozens of unique milestone types unless you have a clear taxonomy.
Page 4 – Capacity and overload
Purpose – make portfolio overload visible so trade-offs can be made realistically.
Include:
- Active projects by team or function
- Projects by delivery phase per team (planning and execution loads differ)
- Overload indicator by critical role or function (manageable, stretched, overloaded)
- Near-term workload peaks based on milestone dates
Tip – you do not need perfect resource allocation. A simple “project load” indicator by team often changes decisions quickly.
Page 5 – Decisions and escalations
Purpose – convert reporting into action by making decision requests visible and time-bound.
Include:
- Decision items grouped by due date
- Decision owner and decision-maker
- Decision type (scope, budget, resourcing, sequencing, risk acceptance)
- Linked project status and rationale
Tip – this is one of the fastest ways to improve governance meetings. If leaders can see what they are being asked to decide, meetings become shorter and more focused.
Optional Page 6 – Benefits and outcomes
Purpose – ensure the portfolio is delivering the outcomes promised.
Include:
- Benefits status (on track, at risk, unknown)
- Benefits category (cost, customer, risk reduction, capacity, compliance)
- Benefits review dates post-handover
Tip – keep this simple at first. Benefits tracking improves over time as reporting maturity grows.
Build interaction that supports investigation, not distraction
The best dashboards allow users to move from “portfolio view” to “project detail” quickly. Use:
- slicers that match how leaders think (department, category, priority, sponsor)
- drill-through pages for a single project view
- tooltips that show status rationale and last updated information
- bookmarks for common meeting views (for example, projects at risk)
Avoid overusing animation or unusual visuals. Your audience wants speed and clarity.
Data quality checks that protect trust
Dashboards lose credibility when data is missing or outdated. Build checks that make these problems visible:
- projects not updated within the reporting period
- projects missing status rationale
- projects with no next milestone date
- projects marked green with overdue milestones
- projects with open high-impact risks beyond due date
These checks can be surfaced as a small “data health” indicator on the executive page. The aim is to improve behaviour gently, not to embarrass teams.
Operating habits that keep the dashboard useful
A Power BI dashboard stays useful when it is embedded into a real rhythm.
Set an update cadence
Agree a day and time when project owners update status (for example, every Thursday by 4pm). Refresh the dashboard after that deadline. Leaders should know the dashboard is current for governance meetings.
Use the dashboard in governance meetings
If you still run meetings from slide decks, the dashboard will not become the source of truth. Use the “projects at risk” page for weekly reviews and the “executive overview” page for monthly portfolio reviews.
Keep the model stable
Frequent changes to fields and definitions undermine trust. Start with a stable minimum set and expand slowly when additional fields clearly improve decisions.
Assign ownership
Someone must own the project data model and consistency. This might be a PMO lead or a small governance function. Without ownership, definitions drift and data quality declines.
Common mistakes and how to avoid them
Building the dashboard before standardising reporting
If status definitions are inconsistent, you will visualise inconsistency. Standardise the basics first.
Making reporting too heavy
Large weekly update requirements create poor compliance. Keep reporting lean and focused on decisions.
Ignoring narrative fields
Dashboards need context. Status rationale and decisions needed keep the dashboard grounded in reality.
Optimising for appearance instead of use
A dashboard should be easy to use in a meeting. If it is hard to navigate, leaders will revert to slides.
A helpful reference for structuring Power BI reporting
If you want an example of how to approach Power BI reporting in a project context and how to connect dashboards to portfolio governance, see this guide to a power bi project management dashboard, which outlines how teams can use Power BI to improve project visibility and decision-making.
A practical first build plan
- Week 1 – confirm minimum data model, status definitions, update cadence, and data sources
- Week 2 – build executive overview and projects at risk pages
- Week 3 – add milestones and decisions pages, introduce basic data quality checks
- Week 4 – add capacity view if project load by team is reliable, then embed in governance meetings
When built around real decisions, a Power BI project dashboard becomes more than a reporting surface. It becomes the backbone of governance, helping leaders see risk earlier, manage overload more realistically, and keep project delivery focused on outcomes rather than noise.